运行gmx分析命令没有必要并行, 因为大部分分析命令都不支持并行, 而且分析耗时也不大. 如果有些分析确实需要运行很长时间, 可以将整个分析脚本作为作业提交.
如果只需要简单地分析一下每个水分子的氢键, 而不关心每个水分子的其他性质, 因为每个水分子的索引号是固定的, 不需要使用gmx select重选, 提前做好 index.ndx 文件即可. 如果还需要每个水分子的其他信息, 方便后面对氢键数作图, 就需要借助gmx select.
gmx select的选区语句需要放在引号中, 但需要注意bash脚本中单引号和双引号的区别. 单引号中的内容都是字面值, 不会进行变量替换, 所以 $i 还是 $i; 双引号中内容会进行变量替换, 还要注意内容中的双引号要转义, 否则出错. 当然, 更保险的作法是将选区语句放到一个文本文件中使用 gmx -select -sf sel.txt.
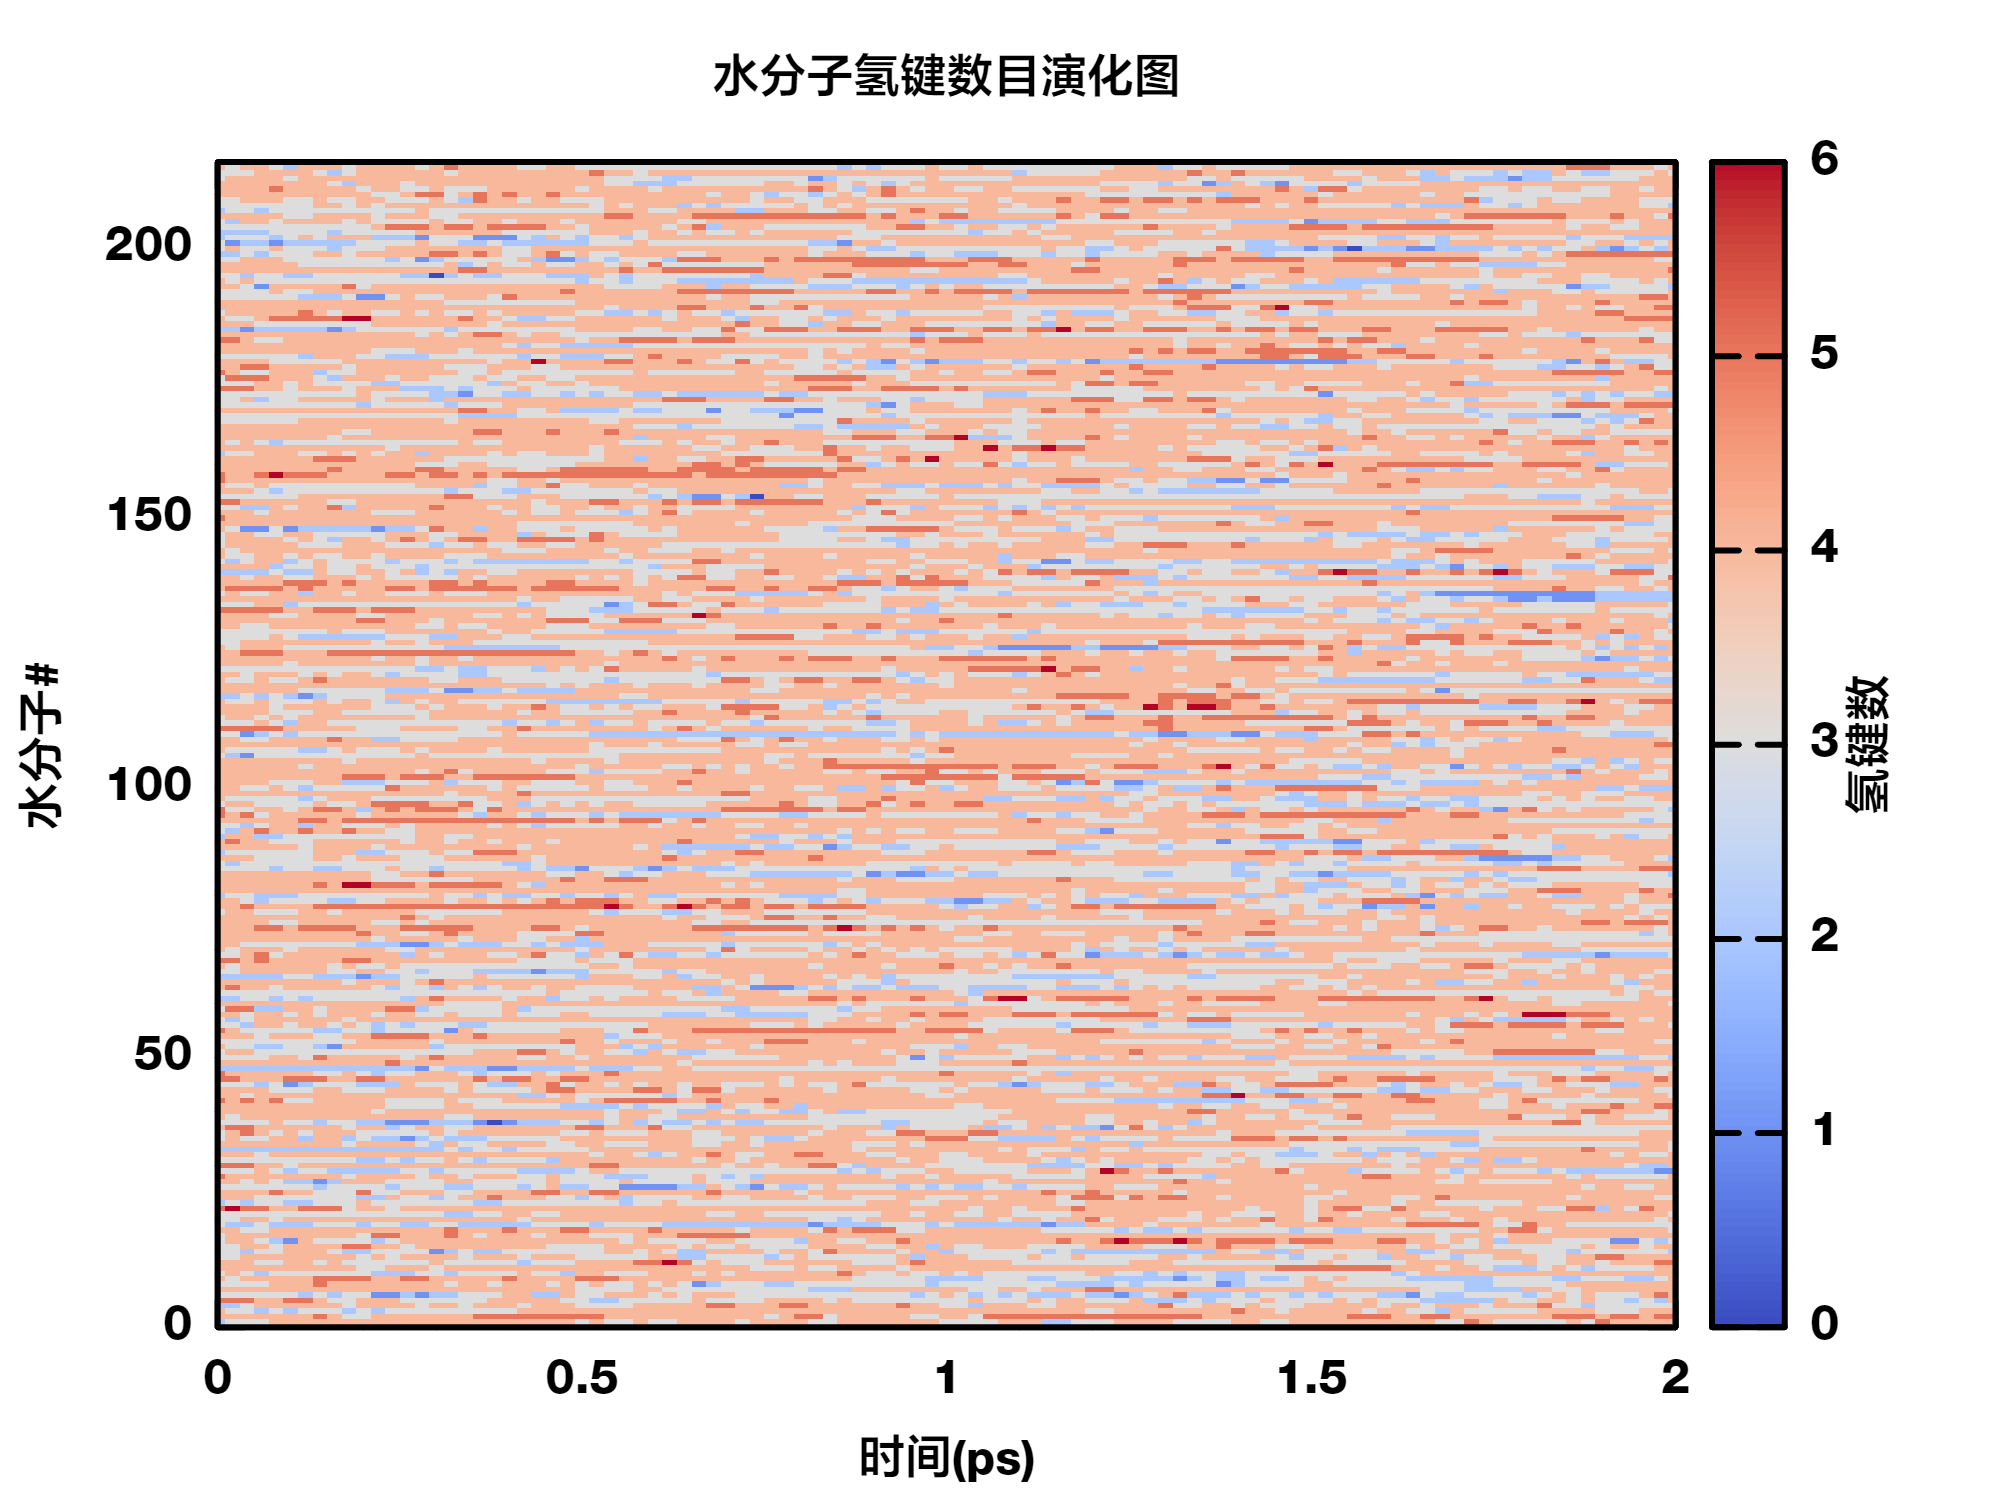
下面让我们来分析一下每个水分子与其他水分子形成的氢键数目随时间的变化.
先假定我们只处理一帧轨迹. 体系中有 216 个水分子, 我们每次选择一个水分子作为选中组, 其余水分子作为非选中组, 创建相应的索引文件, 然后调用hbond计算两个组之间的氢键, 然后对得到的数据进行整理, 输出到需要的文件.
<table class="highlighttable"><th colspan="2" style="text-align:left">hb.bsh</th><tr><td><div class="linenodiv" style="background-color: #f0f0f0; padding-right: 10px"><pre style="line-height:125%"> 1
2
3
4
5
6
7
8
9
10
11
12
13
14
15
16
17
18</pre></div></td><td class="code"><div class="highlight"><pre style="line-height:125%"><span></span><span style="color: #AA22FF; font-weight: bold">for</span> i in <span style="color: #666666">{</span>1..216<span style="color: #666666">}</span>; <span style="color: #AA22FF; font-weight: bold">do</span>
gmx <span style="color: #AA22FF; font-weight: bold">select</span> -quiet -s -on index.ndx &>/dev/null <span style="color: #BB6622; font-weight: bold">\</span>
-select <span style="color: #BB4444">"Wsel = resnr </span><span style="color: #B8860B">$i</span><span style="color: #BB4444">; Wexc = not Wsel;\"Wsel\" Wsel; \"Wexc\" Wexc"</span>
<span style="color: #AA22FF">echo</span> <span style="color: #666666">0</span> <span style="color: #666666">1</span> | gmx hbond -quiet -f traj.xtc -s -n -num hbnum~<span style="color: #B8860B">$i</span>.xvg &>/dev/null
rm -f index.ndx
<span style="color: #AA22FF; font-weight: bold">done</span>
awk <span style="color: #BB4444">'</span>/^ *<span style="color: #666666">[</span>0-9<span style="color: #666666">]</span>/ <span style="color: #666666">{</span>print <span style="color: #B8860B">$1</span>, <span style="color: #B8860B">$2</span><span style="color: #666666">}</span><span style="color: #BB4444">'</span> hbnum~1.xvg > hb~num.xvg
<span style="color: #AA22FF; font-weight: bold">for</span> i in <span style="color: #666666">{</span>2..216<span style="color: #666666">}</span>; <span style="color: #AA22FF; font-weight: bold">do</span>
awk <span style="color: #BB4444">'</span>/^ *<span style="color: #666666">[</span>0-9<span style="color: #666666">]</span>/ <span style="color: #666666">{</span>print <span style="color: #B8860B">$2</span><span style="color: #666666">}</span><span style="color: #BB4444">'</span> hbnum~<span style="color: #B8860B">$i</span>.xvg >_tmp.xvg
paste hb~num.xvg _tmp.xvg >_num.xvg
mv _num.xvg hb~num.xvg
<span style="color: #AA22FF; font-weight: bold">done</span>
rm -f _tmp.xvg</pre></div>
</td></tr></table>获得了数据之后, 我们就可以考虑如何绘制数据了.
根据自己熟悉的程序与软件, 绘制成相应的图.