对于蛋白模拟轨迹, 可以方便地使用gmx rama计算肽键的二面角φ和ψ, 用于绘制Ramachandran图, 也就是常说的拉氏图. 这种图常用于表征蛋白的二级结构, 有时也用于评估蛋白结构是否合理.
gmx rama输出的rama.xvg文件包含的内容如下:
<div class="highlight"><pre style="line-height:125%"><span></span>@ title <span style="color: #BB4444">"Ramachandran Plot"</span>
@ xaxis label <span style="color: #BB4444">"Phi"</span>
@ yaxis label <span style="color: #BB4444">"Psi"</span>
@TYPE xy
@ with g0
@ s0 linestyle 0
@ s0 color 1
@ view 0.2, 0.2, 0.8, 0.8
@ world xmin -180
@ world ymin -180
@ world xmax 180
@ world ymax 180
@ xaxis tick on
@ xaxis tick major 60
@ xaxis tick minor 30
@ yaxis tick on
@ yaxis tick major 60
@ yaxis tick minor 30
@ s0 symbol 2
@ s0 symbol size 0.4
@ s0 symbol fill 1
-131.224 148.225 THR-2
-150.907 147.872 CYS-3
-138.757 146.255 CYS-4
-69.0707 -23.5039 PRO-5
-143.503 169.489 SER-6
<span style="color: #666666">(</span>略<span style="color: #666666">)</span>
-86.3428 156.502 PRO-41
-58.009 -4.88865 GLY-42
-104.401 -23.6048 ASP-43
-121.252 58.847 TYR-44
-96.68 8.08769 ALA-45
-122.848 142.18 THR-2
-142.218 148.986 CYS-3
-136.066 149.023 CYS-4
-76.9576 -13.3019 PRO-5
-151.13 169.091 SER-6
<span style="color: #666666">(</span>略<span style="color: #666666">)</span>
-87.8832 174.68 PRO-41
-82.3377 -6.16846 GLY-42
-99.6951 -8.30811 ASP-43
-127.731 35.0559 TYR-44
-80.2416 10.7315 ALA-45
<span style="color: #666666">(</span>略<span style="color: #666666">)</span></pre></div>很容易看出来, 文件中给出了每帧轨迹中每个残基的(φ,ψ), 但不包括最后一个残基, 因为这两个二面角是两个相邻残基之间的肽键对应的二面角.
最简单的绘制方法就是直接绘制所有点
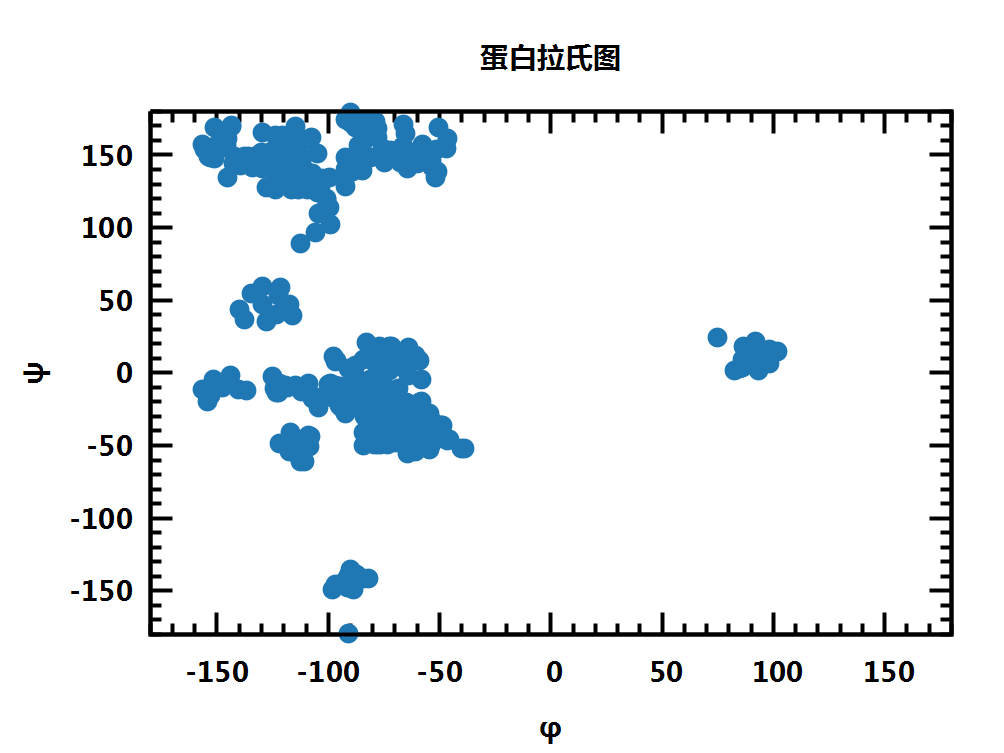
但点数多了之后, 就会重叠在一起, 很难分清, 不直观, 丢失了很多信息.
我们可以做得更好些, 在绘制每个点的时候设置一定的透明度, 这样点重叠越多的地方颜色就越深, 从而能够表明分布密度的大小.
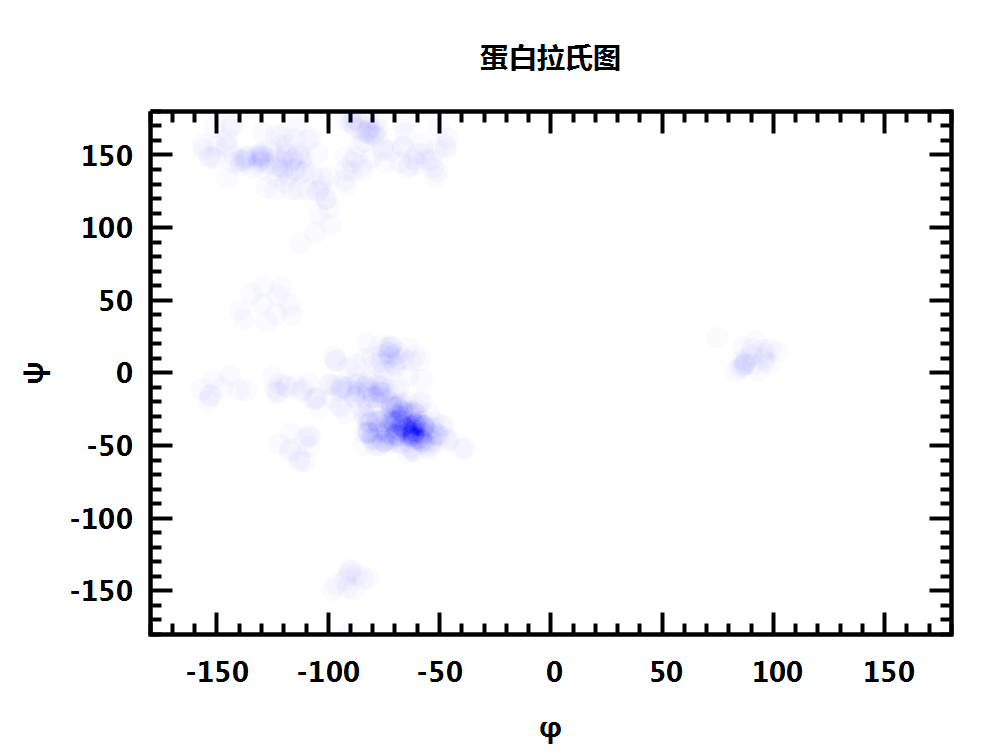
绘制这种图虽然简单, 但透明度很难提前预知, 需要测试才知道什么值给出的效果最好.
最好的解决方案还是绘制热图heatmap. 但这需要先统计(φ,ψ)的二维频数. 简单的几句脚本就可以解决这个问题, 但我还是希望能直接在gnuplot中解决, 所以就花了一点时间看看到底能不能做成. 想了几种貌似可行的简洁方案, 但实际证明都不可行, 因为gnuplot脚本的编程功能有很多限制, 最终还是先计算出频数, 再绘制. 计算时, 使用stat的统计功能, 直接累加处于一定(φ,ψ)范围内的数据个数即可. 方法很笨, 效率很低, 暂时还没想到更优雅的.
<table class="highlighttable"><th colspan="2" style="text-align:left">gnuplot</th><tr><td><div class="linenodiv" style="background-color: #f0f0f0; padding-right: 10px"><pre style="line-height:125%"> 1
2
3
4
5
6
7
8
9
10
11
12
13
14
15
16
17
18
19
20
21
22
23
24
25</pre></div></td><td class="code"><div class="highlight"><pre style="line-height:125%"><span></span><span style="#FF0000">eva</span><span style="color: #AA22FF; font-weight: bold">l</span> <span style="color: #00A000">setpal</span>(<span style="color: #BB4444">'</span>cm_parula<span style="color: #BB4444">'</span>)
<span style="color: #B8860B">dphi</span><span style="color: #666666">=2</span>
<span style="color: #B8860B">dpsi</span><span style="color: #666666">=2</span>
<span style="color: #AA22FF; font-weight: bold">set</span> <span style="color: #AA22FF">print</span> <span style="#FF0000">$</span>rama
<span style="#FF0000">do</span> <span style="#FF0000">for</span> <span style="#FF0000">[</span><span style="color: #B8860B">phi</span><span style="color: #666666">=-180:180:</span>dphi] {
<span style="#FF0000">do</span> <span style="#FF0000">for</span> <span style="#FF0000">[</span><span style="color: #B8860B">psi</span><span style="color: #666666">=-180:180:</span>dpsi] {
<span style="#FF0000">stat</span> <span style="#FF0000">'rama.xvg'</span> <span style="#FF0000">u</span> <span style="#FF0000">(</span> <span style="#FF0000">(p</span><span style="color: #AA22FF; font-weight: bold">hi</span><span style="color: #666666">-</span>dphi<span style="color: #666666">/2<=</span><span style="#FF0000">$</span><span style="color: #666666">1</span> <span style="color: #666666">&&</span> <span style="#FF0000">$</span><span style="color: #666666">1<</span>phi<span style="color: #666666">+</span>dphi<span style="color: #666666">/2</span> <span style="color: #666666">&&</span> psi<span style="color: #666666">-</span>dpsi<span style="color: #666666">/2<=</span><span style="#FF0000">$</span><span style="color: #666666">2</span> <span style="color: #666666">&&</span> <span style="#FF0000">$</span><span style="color: #666666">2<</span>psi<span style="color: #666666">+</span>dpsi<span style="color: #666666">/2</span>) <span style="color: #666666">?</span> <span style="color: #666666">1:0</span>) nooutput
<span style="color: #AA22FF; font-weight: bold">print</span> phi<span style="color: #666666">,</span> psi<span style="color: #666666">,</span> STATS_sum
<span style="#FF0000">}}</span>
<span style="color: #AA22FF; font-weight: bold">set</span> <span style="color: #AA22FF">tit</span><span style="color: #BB4444">"蛋白拉氏图"</span>
<span style="color: #AA22FF; font-weight: bold">set</span> <span style="color: #AA22FF">xl</span><span style="color: #BB4444">"φ"</span>; <span style="color: #AA22FF; font-weight: bold">set</span> <span style="color: #AA22FF">yl</span><span style="color: #BB4444">"ψ"</span>
<span style="color: #AA22FF; font-weight: bold">set</span> <span style="color: #AA22FF">label</span> <span style="color: #BB4444">"α螺旋(3.6_{13})"</span> at <span style="color: #666666">-57.8,</span> <span style="color: #666666">-47</span> front font <span style="color: #BB4444">",50"</span> textcolor <span style="color: #BB4444">"white"</span>
<span style="color: #AA22FF; font-weight: bold">set</span> <span style="color: #AA22FF">label</span> <span style="color: #BB4444">"β折叠(反平行)"</span> at <span style="color: #666666">-139,</span> <span style="color: #666666">135</span> front font <span style="color: #BB4444">",50"</span> textcolor <span style="color: #BB4444">"white"</span>
<span style="color: #AA22FF; font-weight: bold">set</span> <span style="color: #AA22FF">label</span> <span style="color: #BB4444">"β片(平行)"</span> at <span style="color: #666666">-119</span> <span style="color: #666666">,</span> <span style="color: #666666">113</span> front font <span style="color: #BB4444">",50"</span> textcolor <span style="color: #BB4444">"white"</span>
<span style="color: #AA22FF; font-weight: bold">set</span> <span style="color: #AA22FF">label</span> <span style="color: #BB4444">"π螺旋(4.4_{16})"</span> at <span style="color: #666666">-57.1,</span> <span style="color: #666666">-69.7</span> front font <span style="color: #BB4444">",50"</span> textcolor <span style="color: #BB4444">"white"</span>
<span style="color: #AA22FF; font-weight: bold">set</span> <span style="color: #AA22FF">label</span> <span style="color: #BB4444">"γ螺旋(2.2_7)"</span> at <span style="color: #666666">-70</span> <span style="color: #666666">,</span> <span style="color: #666666">70</span> front font <span style="color: #BB4444">",50"</span> textcolor <span style="color: #BB4444">"white"</span>
<span style="color: #AA22FF; font-weight: bold">set</span> <span style="color: #AA22FF">label</span> <span style="color: #BB4444">"2.0_5螺旋"</span> at <span style="color: #666666">-175</span> <span style="color: #666666">,</span> <span style="color: #666666">-175</span> front font <span style="color: #BB4444">",50"</span> textcolor <span style="color: #BB4444">"white"</span>
<span style="color: #AA22FF; font-weight: bold">set</span> <span style="color: #AA22FF">label</span> <span style="color: #BB4444">"3.0_{10}螺旋"</span> at <span style="color: #666666">-49</span> <span style="color: #666666">,</span> <span style="color: #666666">-26</span> front font <span style="color: #BB4444">",50"</span> textcolor <span style="color: #BB4444">"white"</span>
<span style="color: #AA22FF; font-weight: bold">set</span> <span style="color: #AA22FF">label</span> <span style="color: #BB4444">"PPI 螺旋"</span> at <span style="color: #666666">-75</span> <span style="color: #666666">,</span> <span style="color: #666666">160</span> front font <span style="color: #BB4444">",50"</span> textcolor <span style="color: #BB4444">"white"</span>
<span style="color: #AA22FF; font-weight: bold">set</span> <span style="color: #AA22FF">label</span> <span style="color: #BB4444">"PPII 螺旋"</span> at <span style="color: #666666">-75</span> <span style="color: #666666">,</span> <span style="color: #666666">150</span> front font <span style="color: #BB4444">",50"</span> textcolor <span style="color: #BB4444">"white"</span>
<span style="color: #AA22FF; font-weight: bold">set</span> <span style="color: #AA22FF">label</span> <span style="color: #BB4444">"左手α螺旋"</span> at <span style="color: #666666">57.8</span> <span style="color: #666666">,</span> <span style="color: #666666">47</span> front font <span style="color: #BB4444">",50"</span> textcolor <span style="color: #BB4444">"white"</span>
<span style="color: #AA22FF; font-weight: bold">plot</span> [<span style="color: #666666">-180:180</span>][<span style="color: #666666">-180:180</span>] <span style="#FF0000">$</span>rama <span style="color: #AA22FF">u</span> <span style="color: #666666">1:2:3</span> <span style="color: #AA22FF">w</span> imag</pre></div>
</td></tr></table>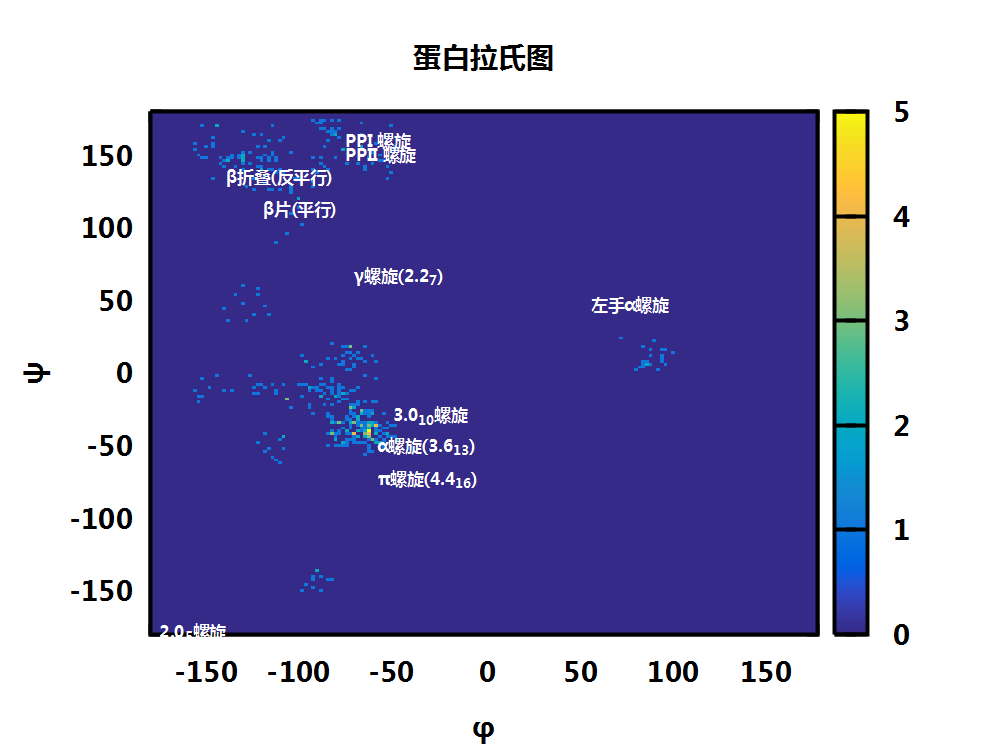
最后说一句, python的matplotlib有直接绘制2D直方图的功能, 可以参考Visualization with Matplotlib. 这本书有中文版, 值得推荐.